By mid-March of this year, most of the country had the things they wouldn’t think they could ever lose taken from them — concerts, dining in a restaurant, haircuts, sitting in a movie theater — which led to a greater appreciation for these missing things and the professionals that make them happen.
The things we could still do all centered around the home. And many of us discovered that what waited at home wasn’t that great. Fortunately, there are pros for that, too, and clients received a newfound appreciation for custom installation services, and a greater need than ever before, leading to a lot of busy shops.
It’s not over — not 2020 and certainly not the pandemic — but we’ve come far enough to where it is time to take stock and see what the heck we’ve been through and where we are at in the new now (we can’t say “the new normal” as we are months away from being able to call anything “normal”). For the custom installation industry, the outlook looks promising, which seems strange to say in light of so many other small businesses suffering, but it’s true.
Let’s look at some of the recent trends.
Looking at the Specs
More than one thousand integrators use Portal.io to spec out their jobs, giving the company a front-row seat to the current trends in client needs. Portal founder and CEO Kirk Chisholm and president Josh Willits provided the charts you see on these pages, and offered some thoughts on the findings.
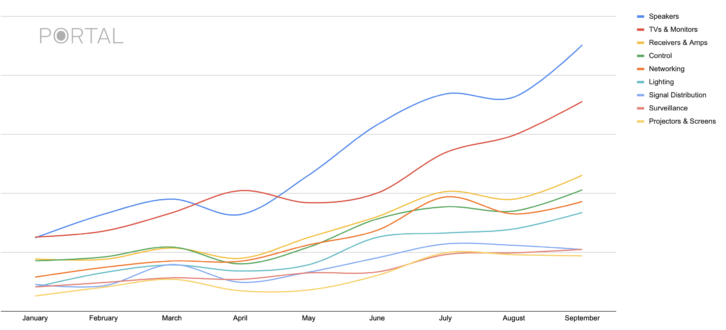
Figure 1 shows the leading categories according to dollar value — the amount specified by integrators. Not surprisingly, the main categories, speakers and televisions, are at the top, as they are also the most expensive. The trend goes across most of the categories, though — a spike in March followed by a dip through April, then a steady climb that continues through September.
“What’s been happening since Covid is pretty interesting, but it’s not a huge surprise,” states Chisholm. “We stayed steady and then it shot up and it’s continuing to go up — July was better than June, August was better than July, September was better than August. It just keeps going up.”
“What we might be seeing here in these last three months is all the business that was queued up and on hold from March through April stacked up with the new business opportunity in the summer,” adds Willits. “And that’s why it jumped as high as it did.”
Initially, it was assumed that home networking would be a priority for customers as everything moved home — work, school, and entertainment. Portal’s research supports that theory, but it also shows that, after the growth spike, it levels off near the end of summer.
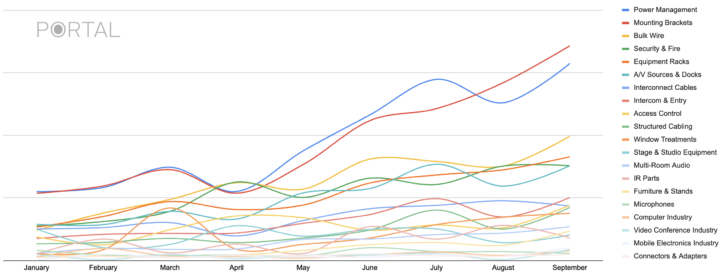
Figure 2 takes the big-ticket entertainment items out of the equation to show how the remainder of the home AV and automation system market fared. For the most part, they follow the same trend of a spike in March, fall through April, then steady climb through September. But a few categories proved to be more consistent that the others.
“Everything was was definitely dropping in March, although intercom and entry and security and fire didn’t really go down,” notes Willits.
So now we get how 2020 went, but how does that compare with proposals in 2019? Figure 3 shows the specification of televisions for 2019 vs. 2020, revealing that 2019 was fairly stable throughout the year and the growth in 2020 is staggering.
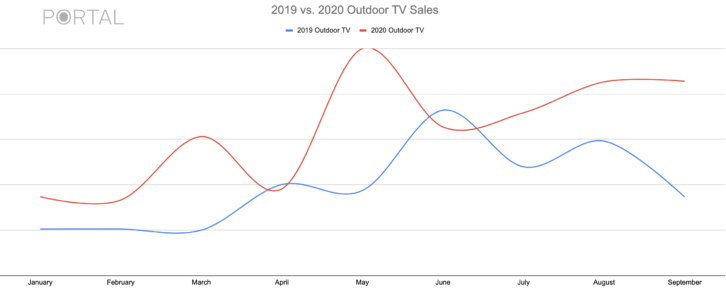
Figure 4 shows the same stats for outdoor sales. Outdoor AV is a much more seasonal sale, and 2020 was already on a path to greatly surpass 2019 sales before the pandemic hit. After Covid-19, it skyrockets, only going beneath 2019 levels in June and then heading into the fall without the seasonal drop-off that is seen in 2019.
Another popular proposal tool, D-Tools, offers similar stats to Portal’s. According to D-Tools CEO Randy Stearns, “Recent data from D-Tools Cloud, a web-based productivity tool used by several hundred residential system integrators, shows that retrofit projects have grown at a remarkable rate of 28 percent per month (average) during the pandemic (March to September), indicating a significant surge in home improvement projects. Much of this growth came from product categories you’d expect to see associated with home improvement projects — TVs, networking, and control products/systems.”
Back in April, when we heard from integrators, the concern wasn’t for the immediate future, as they had a backlog of jobs to get them through July. Rather the concern was after that when there was a gap in the pipeline. According to the data, that gap has not yet come.
Related: Working in Unprecedented Times
Studying the Sales
To see if the proposal statistics match those seen in sales of CI-related gear, we checked in with the PowerHouse Alliance, which is a national consortium of regional wholesale distributors that sells to the residential marketplace.
“Across the PowerHouse Alliance, our top-selling categories have included networking, home control and security, and entertainment equipment, specifically audio and video,” says PowerHouse Alliance executive director Dennis Holzer. “From January, our numbers were on target through projections, but the networking and entertainment categories increased each month starting in March.
“Network has been, by far, the category with the greatest increase. PowerHouse carries Luxul, Ubiquity, eero, and Aruba, and, since numbers started going up in March, our numbers have doubled. While networking has exploded, we’ve also seen increases in TV sales.”
That matches what was shown on the proposal side, but the increase in product demand raises another serious issue facing integrators — lack of supply.
“Through the year, the supply of product stayed consistent; but now, coming out of September, the vendor shipping rate is about 70 percent,” adds Holzer. “I foresee this sustaining or slightly decreasing in the next few months. It’s important to consider that, while the shipping rate is down, manufacturers of booming categories like networking and TVs are shipping 1.5 to 2 times over the amount of product they forecasted for the year. Most companies had forecasted a 15-to-20 percent increase of inventory year over year, and now they’ve been shipping at about 100 percent increase — far outdoing expectations.
“Over the next few months, we expect some of this to settle, but some categories may meet delays as manufacturers push to meet these new demands well into 2021.”
As the clock runs out on this year, it may be an understatement to say that few things have been consistent in 2020. Fortunately, one of those things has been the need for residential integration services, which, as of this moment, show no signs of slowing down.
Residential Systems is now on LinkedIn! Click here to follow us for business and technology insights!
The Consumer View
Futuresource Consulting recently released its quarterly reports in a number of CE categories that are part of the CI world. Here are a some of the findings.
TV Displays
- The Covid-19 lockdown actually benefited TV sales in many countries during H1 as consumers withdrew into their homes and focused more on home entertainment.
- As part of the premium segment, OLED uptake is likely to be hampered by the Covid-19 economic impact, as consumers economize. OLED is forecast to reach 3.4m units worldwide in 2020, representing 1.5 percent of global shipments in 2020, rising to nearly 4 percent in 2024.
- With already existing barriers such as lack of content and high prices being exacerbated by the pandemic, 8K shipments are set to reach just 495K units for 2020, representing only 0.2 percent of the market.
- 4K UHD continues to grow its share of the TV market; 62 percent of shipments in 2020, as brands continue to transition their ranges from HD.
Soundbars
- More consumers than ever before are augmenting their TV sound, with shipments of soundbars increasing 5 percent last year to reach 18.8m units
- Value grew even quicker at 6 percent with consumers increasingly willing to spend more on feature-rich soundbars that boast better audio quality and enhanced features
- Sales of Dolby Atmos soundbars rocketed up 126 percent compared to 2018 with this technology, and similar technologies such as DTS:X, becoming common in high-end soundbars. The majority of the major international soundbar vendors now boast at least one model with 3D audio technology, and demand is set to continue to grow dramatically in the coming years as more and more vendors release models at mass market price points
- Sales are forecast to decline slightly for full-year 2020 as the economic impact gathers pace, but this slight decline is better than many other consumer electronics categories and the longer term Post-Covid outlook remains upbeat.
Smart Home
- After shipping 100m devices worldwide in 2018, smart home devices grew to 137m in 2019. Futuresource segments smart home into the following categories: Hubs & Control Devices, Security & Monitoring, Climate Control, Lighting Systems, and Power.
- Smart home will still outperform most other consumer device segments achieving a global CAGR of 22 percent for period 2019-2023. Mature smart home markets such as North America are expected to grow on average 13 percent a year, whereas Eastern Europe is expected to see a 30 percent CAGR.
- Key motivators for buying smart home devices are convenience, security, remote control, and saving money.
- The global pandemic has had a varying impact on the differing smart home product categories. For example, sales of smart water and smoke detectors have boomed, while smart security devices have seen a downturn. We expect smart security device sales to bounce back post-pandemic as consumers spend less time in their homes. Smart lighting has also seen a slight uptick in sales, in line with what was expected.
- Security and monitoring remains the key use case in smart home. The category accounts for 60 percent of shipments in the industry and is a common first smart home step for households. Importantly, security devices, along with climate control, are the most likely to be provided to consumers through service providers.
- For the DIY-buying consumer, a smart speaker and security devices remain the gateway products for attracting consumers into the smart home world. For a consumer looking to purchase a smart home device that has a bolt-on subscription/service model, the security video camera with recording capabilities, is undoubtedly the gateway product.
Related: Fighting the Battle of Next Week