As we power through the final quarter of 2025, it is the right time to take stock of the year that was and see how we are doing as an industry. As we have done every year since 2020, we are once again looking at the market through the lens of won proposals of dealers using Portal.io’s platform. The data has been compiled by Portal COO Josh Willits, who also provides insights on the numbers.
Overall Sales by Month
As much as it continuously surprises me, I am a “glass-half-full” kind of person, but I think even the most pessimistic among us could see some good news when looking at the Overall Sales by Month chart in Figure 1.
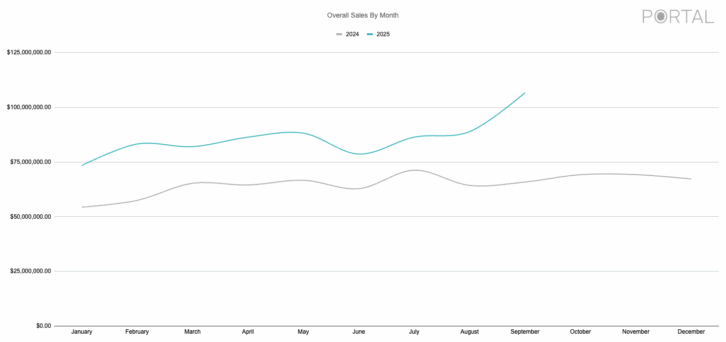
Let’s pick it up at the beginning, with January 2024’s $50 million-plus in sales compared to 2025’s near $70 million. Willits points out that this data has been normalized, meaning that it only includes dealers who have used Portal.io over the past two years, roughly 1500 integrators. It does not include any company that joined Portal.io after the end of December 2023.
While we will stay away from conjecture during this exercise, Willits does note tangible reasons for the increase in revenue.
“The average job size is growing,” he says. “The dealers on our platform are selling more, and they’re growing. Again, this is normalized data, so this is the same group of dealers. You can see they grew from $54 million in January 2024 to $67 million in January 2025. They continued their growth throughout 2025 at about the same rate as 2024; the gap between the blue and the gray is consistent. There’s a bump in February 2025, which is when tariffs were first announced. It’s hard to draw a corollary here specifically, but it fits the narrative — close the business before prices go up. It levels back out in March. The growth slowed in June and July. Summer year-to-year usually sees a dip, so this isn’t surprising, but the recovery through August and September has been really strong.
“Plus, in addition to growing the size of the jobs, the number of projects also increased. This year, in the first quarter, our dealers averaged seven jobs per month, and in the second quarter, they hit eight jobs on average. The average in the third quarter is also eight. In the last two years, this group has gone from an entire quarter average of six projects per month to eight projects per month that they’re winning.”
Product Data
As we turn to product categories, the main ones are featured in Figure 2. The category charts have also been normalized, but only for 2025, so they include dealers who joined by the end of December 2024, around 2000 in total.
Looking at Figure 2, it looks pretty close to versions from previous years, complete with a summertime dip that hits most categories. Speakers again take the top spot, followed again by televisions. But then things get interesting.
“Lighting control overtook receivers and amps,” says Willits. “TVs in aggregate are still higher than lighting controls, but lighting controls surpassed TVs in January, March, May, and, though it doesn’t show in this chart, September. And it’s not like TVs are declining — lighting control is growing pretty significantly.”
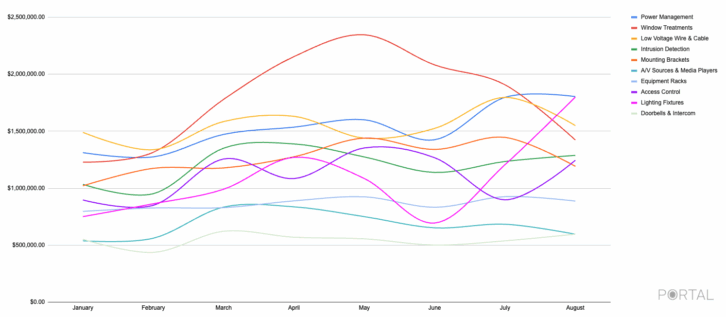
On the secondary categories, shown in Figure 3, window treatments and their big bell curve leap out of the data. Likewise, power management has had a stronger showing this year compared to last. The other categories are similar to last year’s chart, with doorbell and intercom running along the bottom, but with $500,000 in sales, that’s not a bad lower rung.
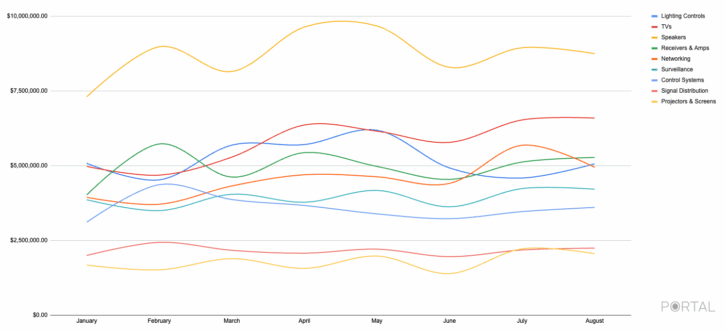
Figure 4 takes a dedicated look at the lighting industry, which Figure 2 already showed to be in a growth period. From January 2024 through February 2025, it seems to have its ups and downs, but from Spring on, it takes off. In March 2025, the category hit over $1 million in sales. It dips in June, but March, April, May, July, and August are all over $1 million. And in August, it goes sky high.
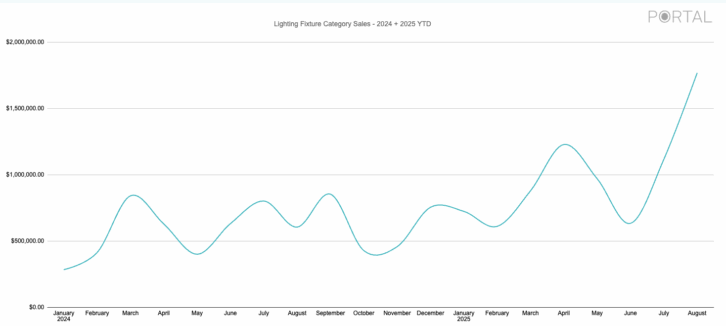
“If I add lighting fixtures data for September, it’s higher than where August ended up,” adds Willits. “Not by much — it’s very similar to August, but it’s $1.8 million. So, we’re close to $2 million, and at the beginning of the year, it was around $750,000.”
The other category spotlighted this year is on projectors and screens, which can be seen in Figure 5. With TVs remaining dominant and coming in larger sizes, as well as more video wall options entering the market, it seemed worthwhile to check in on this venerable, typically steady category.

In 2025, it was a much more volatile time for projectors and screens, and, although 2024 was more consistent, 2025 brought in considerably more money, with a rise in July that continued throughout September.
“You can see the June dip, which we always get, and this year also likely saw some economic impact that essentially resolved in July,” says Willits. “But that growth rate — the gap in the graph — stayed consistent for that entire quarter. It jumped up in July, indicating a higher growth rate in this category for this most recent quarter, compared to the first two quarters of 2025.”
The Distributor’s View
Of course, won proposals are just one piece of the puzzle. To help check our work, we asked Cynthia Menna, VP and general manager, AV, for ADI | Snap One, about the product trends and use cases the distributor is seeing.
“In today’s increasingly connected world, the demand for robust networking solutions has never been greater,” says Menna. “As more people work from home and rely on home offices, a stable and high-speed network is essential for productivity and seamless communication. Beyond work, households are embracing digital lifestyles that include online gaming, streaming family entertainment, and smart surveillance for security.
“All these innovations depend on a reliable network infrastructure that can support multiple devices and applications simultaneously, making networking a foundational element of modern living.”
Like networking, outdoor spaces are another area that grew to prominence during Covid, and, according to Menna, remains popular. “Outdoor spaces are increasingly being treated as true extensions of the home,” she says. “As a result, integrated solutions such as automation systems, lighting controls, and voice-activated routines are becoming standard features that deliver greater convenience, energy efficiency, and enhanced security.”
Another continuing trend is integrators expanding into light commercial and semi-commercial environments. “More and more residential clients are seeking commercial-grade AV solutions, so the once-clear line between residential and commercial AV is becoming increasingly blurred,” says Menna. “This convergence is reshaping expectations, design standards, and integration strategies across both sectors.”
CI staples also remain vital: “Audio continues to evolve, driven by demand for weatherproof outdoor kits, discreet ‘invisible’ installations that complement design and aesthetic preferences of residential spaces, along with customizable, immersive sound experiences,” explains Menna. “Smart home projects increasingly bundle sensors, remote management, and seamless integration with access control and surveillance systems.
“Finally, we’re also seeing integrators continuing to win share in this dynamic and evolving broader economic climate through differentiation.
“Taken together, these proposals reveal a market that is both navigating challenges successfully and accelerating innovation, driven by a clear shift toward smarter, more seamless, and lifestyle-centric technologies.”
What’s It Mean?
Of course, just because the industry appears to be robust doesn’t necessarily mean it is in your area or your business. As with most research, results may vary. It is the hope that your businesses are seeing the same kind of success this data represents, but, if not, at least you can see that not only is the demand there, but so are the areas where it is concentrated most, providing solid intelligence on where to steer your efforts in 2026.
D-Tools’ 2025 Smart Home Market Shows Modest Growth, Steady Demand
By Jason Knott, Data Solutions Architect and Evangelist, D-Tools
Despite tariffs and lingering inflation concerns, the first half of 2025 delivered steady growth for the professional installation side of the residential smart home market. Sales rose 7.4% year-over-year, and demand remains robust, proving that homeowners continue to prioritize connected living experiences.
This data comes from the D-Tools Midyear Market Update report, based on 105,000 proposals and 40,000 signed contracts created in D-Tools Cloud by more than 3000 integrators — a rock-solid benchmark for comparing your own performance. Full details are available as a free download on d-tools.com.
Proposals and Contracts: Pipelines Stay Full
Proposal activity climbed 7% versus H1 2024, showing no sign of a slowdown. Signed contracts grew 6.9%, with homeowners showing no hesitation to move forward on projects despite tariff-driven price fears. Seasonality looks normal, and demand remains strong, which is a healthy sign for the remainder of the year.
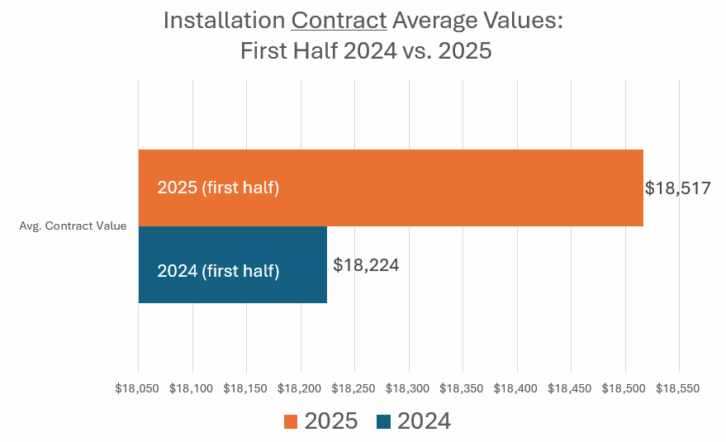
In terms of the values of proposals versus contracts, it was a tale of two cities, so to speak. While proposal values rose by double digits, contracted values barely nudged higher, further widening the proposal-to-contract gap. This suggests:
- Clients are trimming budgets to focus on essentials.
- Integrators may be presenting “stretch” proposals that inspire, but don’t always close at full scope.
Tightening proposals to match realistic budgets while still upselling key features (lighting control, networking, security) could boost closing ratios and project profitability.
Looking at the market activity at the category level, security cameras are the most-installed category, overtaking displays. Bundling surveillance with networking, access control, and automation scenes creates stickier, higher-value projects.
Key Takeaways for Residential Smart Home Integrators
The first half of 2025 confirms that smart home demand is healthy. Homeowners still want better entertainment, security, and control…, and they’re willing to invest. For integrators, the first half of D-Tools’ data suggests that they:
- Benchmark Growth: If an integration company is not seeing anywhere near 7%-plus growth, it might be time to review lead-gen and proposal workflows.
- Sharpen Scope: Balance visionary proposals with realistic budgets to improve conversion rates.
- Ride the Demand Wave: Focus on hot categories like surveillance, networking, and lighting fixtures and lighting control to drive upsell opportunities.
Download the D-Tools Midyear Market Update report on d-tools.com.