It’s that time of year again when we have come far enough along to look back and search for the trends and ideas that will help shape our 2027. Not sure what makes it feel right to do it now — maybe it’s the calendar running out of pages or the inward thoughts the cooler weather brings for those of us who experience it — but the recent release of industry data, including the CEDIA “2026 U.S. Professional Smart Home Market Analysis” and D-Tools’ “2026 Midyear Report,” certainly helps create the right environment for such thinking.

This year, we will start off with some size-of-industry data from the CEDIA report and then do our annual dive into data provided by our friends at Portal.io that looks at what products — and how much of them — were being sold this year. We also have a sidebar that features some research from the D-Tools report.
Market Size and Vibes
The CEDIA “2026 U.S. Professional Smart Home Market Analysis,” the first report since CEDIA launched its own research division earlier this year, was produced in partnership with The Farnsworth Group and included 287 completed interviews using CEDIA member and partner contact lists. The interviews were conducted between May 26 and June 30, 2026.
The report finds that the size of the custom installation market in the U.S. is estimated at $33.8 billion. Large firms (more than 20 employees) account for about 15% of companies but generate 43% of market revenue. By comparison, small firms (1-5 employees) account for 65% of companies, but just 29% of market revenue. In terms of product categories, the survey found home networking (15%), distributed audio (11%), and lighting/shading (11%) at the top of the list.
In 2023, the last time CEDIA offered this report, the size of the industry was estimated at $29 billion, which points to a 16.55% increase over the three years. U.S. inflation rose at 9.94% over that same period, so it does indicate a sizable bump in our market value.
The interviews also covered expectations from those surveyed, which resulted in almost eight in ten firms saying they expect revenue growth over the next year, while 4% anticipate a decline. In terms of business opportunities, respondents said that lighting (17%), AI integration (13%), and product diversification (12%) are the topics to look out for.
Speaking of AI, 58% of respondents saw an increase in AI-related customer requests, while 79% saw an increase in the use of AI in their business systems.
If you want to check out the full report — which is free for CEDIA members and $999 for non-members — it is available at http://my.cedia.org/Shop/.
What Is in Won Proposals
For the sixth consecutive year, Portal has been kind enough to provide us with a look at the market through the lens of won proposals from dealers using the Portal.io platform. As the company does each year, the category charts have been normalized for 2026; they include dealers who joined by the end of December 2025, so any growth comes from the existing dealer proposals, not more proposals from more dealers. Lee McDonald, director of vendor services at Portal, provides some perspective.
Figure 1 shows Overall Sales by Month, comparing 2025 and 2026 through August. Interestingly, the lines seem to mirror each other, with increases on one showing drops in the other — and vice versa — in the same time period year over year. The key takeaway is that 2026 starts at more than $100 million, and only goes up.
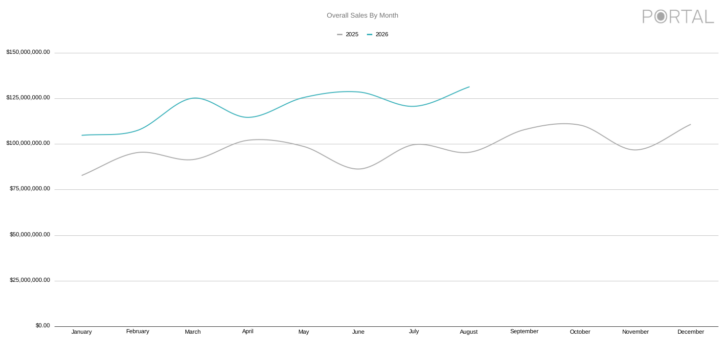
“Looking at the overall dealer sales for the year versus last year over the same period, sales are up 27.5%, from $749.5 million to $955.8 million, and every month was higher than the same month in 2025,” says McDonald. “Every month from March on was also higher than any single month of 2025, and August was the highest month on the chart at $131.1 million.
Flashback: State of the Industry 2025
“On a per-dealer basis, each dealer closing business on Portal averaged about $79,500 a month in sold proposals, up 14% from about $69,800 last year. That growth came from bigger projects rather than more of them. Dealers closed about six proposals a month in both years, while the average sold proposal grew from $11,300 to $13,100. The number of dealers closing business each month was also up about 12%.”
In Figure 2, we see sales of the top categories, including TVs, Speakers, and Lighting Control. “There was more shuffling in the top categories this year,” McDonald explains. “Speakers is still first in every month and is up 23% over the same period last year. Lighting Controls is third, ahead of Receivers & Amps, and the gap between Lighting Controls and TVs was cut roughly in half, from $7.5 million to $3.6 million. Lighting Controls outsold TVs every month from January through April. Surveillance grew the fastest of the group at 39% — now even with Networking — and Control Systems grew 22%. Window Treatments, which sits on the second-tier chart, now outsells both Signal Distribution and Projectors & Screens, and would rank eighth overall. We kept the same categories on each chart as last year, so the two years compare directly.
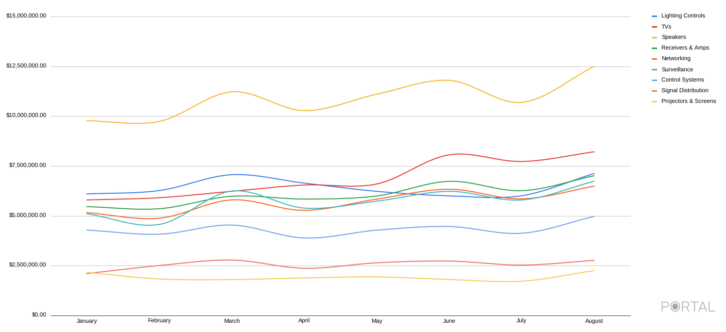
“TVs had a strong summer. They took the lead back from Lighting Controls in May and then jumped in June, and from June through August they were up 30% over last year, compared with 12% from January through May.
“In the secondary categories, shown in Figure 3, Window Treatments holds the top spot again, up 52%, and it led the group in every month except February,” McDonald continues. “Lighting Fixtures moved into second, and every second-tier category grew over last year. Access Control had a big February, and that came from larger projects rather than more of them — the average Access Control project that month was about $4300, against roughly $2400 the rest of the year.
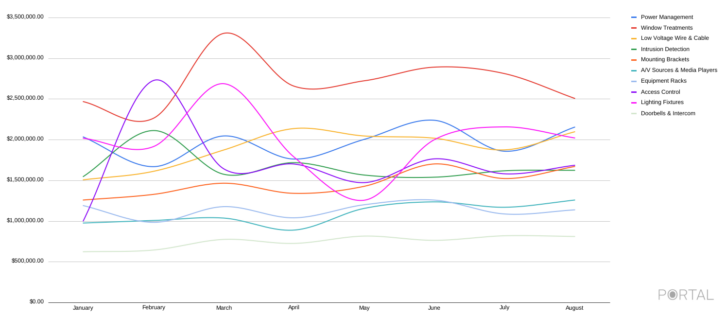
“Last year, every one of the top categories dipped in June, and overall sales fell about 13% from May. That didn’t happen this year. June was up slightly over May, and seven of the top nine categories grew month over month. The summer slowdown showed up in July instead, when overall sales eased about 6%, and every top category was back up in August.”
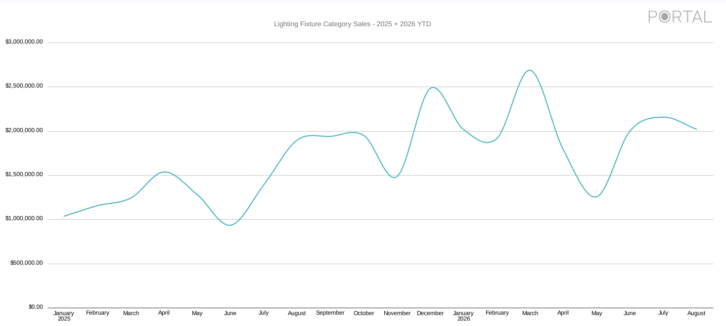
With Lighting Fixtures targeted for continued growth, we asked Portal to track its progress over the past two years, which is shown in Figure 4. “Lighting Fixtures continues to grow, up 52% over the same eight months last year,” says McDonald. “Before August 2025, the category never topped about $1.5 million in a month, and since then it has averaged close to $2 million a month, peaking at $2.7 million in March. The number of proposals with fixtures on them is up 38%, so the growth is coming from both more jobs and bigger ones.”
Another category that bears watching is Projectors & Screens (Figure 5), which has been a staple in the industry for decades, but is now facing competition from larger direct-view televisions and video walls.
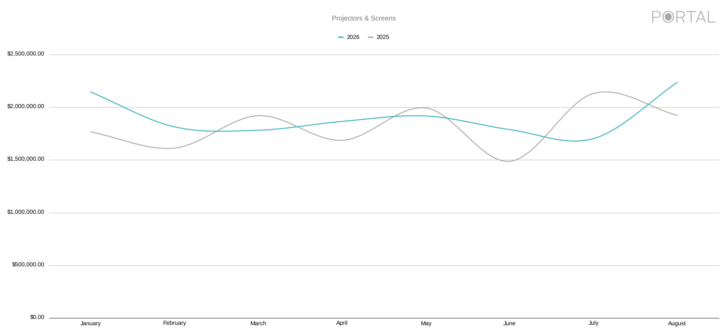
“Projectors & Screens is roughly flat this year, up 5%, while overall sales grew 27.5%,” says McDonald. “The two years trade places month to month, with 2026 ahead in five of the eight months. August was the category’s best month of the year at $2.2 million.”
Related: CEDIA Reveals New Data on $33.8 Billion US Residential Technology Market
Looking back to 2024, however, shows that Projectors & Screens have enjoyed a considerable amount of spend between then and 2025, never making it near $1.5 million in 2024, but being over that number — often well over — in both 2025 and 2026.
How Do You Compare?
Overall, custom installation is looking like a solid industry to be a part of, but, of course, results may vary. Does your past year resemble what we see in the research? Are you noticing any trends that aren’t reflected here? Drop me a line at [email protected] and let me know how your year has been.
For more information about Portal and its services, visit http://portal.io.
The Middle Market Got Squeezed in 2026
By Jason Knott, Data Solutions Architect & Evangelist, D-Tools
On paper, the custom integration channel is strong. According to the D-Tools “2026 Midyear Market Report,” drawn from tens of thousands of signed contracts and proposals generated in D-Tools Cloud, the industry posted a healthy median sales growth rate of 14% in the first half of the year compared to the same period in 2025. Average signed-contract value rose 10.4% to $16,595, and integrators closed 17% more contracts per company than a year earlier.
That sounds glorious, doesn’t it? But underneath that topline data, the market seems to be splitting in two. More than one-third of integrators (34.8%) saw sales rocket up 51% or more in the first half of the year. Great news! However, nearly as many (33.4%) saw sales fall 21% or more. The remaining third were roughly flat. That does not appear to be a market moving in one direction, but rather two markets moving in opposite directions at the same time, and the divide cuts straight through the middle of the price list.
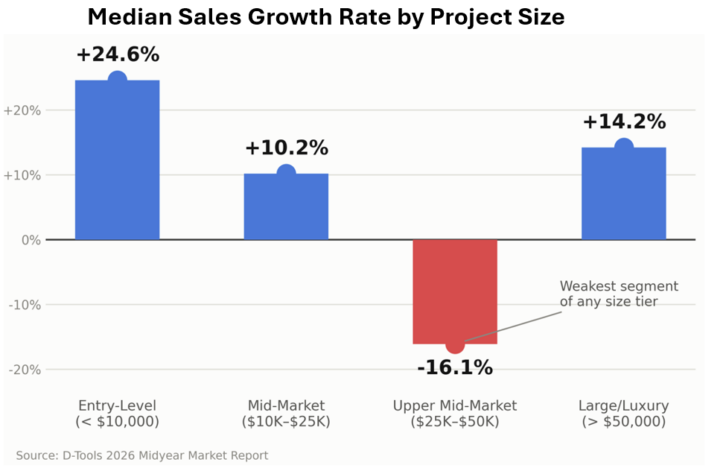
If you segment the data by average contract size and the pattern gets sharper. Entry-level integrators, averaging under $10,000 per contract, grew a median 24.6%. Large and luxury integrators, averaging over $50,000, grew 14.2%. The two extreme ends of the market are fine. It’s the middle that’s showing cracks:
- Entry-Level (under $10,000): +24.6% median growth
- Mid-Market ($10,000–$25,000): +10.2%
- Upper Mid-Market ($25,000–$50,000): –16.1%
- Large/Luxury (over $50,000): +14.2%
Integrators concentrated in the $25,000–$50,000 upper-middle bracket posted a median decline of 16.1%. That segment is where the classic whole-home audio, video, and lighting package for an upgrading suburban homeowner often sits.
Why Is the Upper Middle Market Struggling?
If we look more broadly beyond just the D-Tools integrator channel data to examine the macroeconomic data, there is plenty of evidence of how the upper-middle market segment is being squeezed.
Housing: Looking at the housing market, single-family starts that feed new-construction and major-renovation projects that typically land in the $25K to $50K range are forecast to fall to 904,000 in 2026, down from 941,000 in 2025, according to NAHB data. Moreover, housing permits are also declining, which is a leading indicator that suggests more softness ahead. Fewer new homes means fewer proposals for integrators.
Mortgage Rates: As of the end of March 2026, nearly half of homeowners with a mortgage (49.9%) still carry a rate under 4%, and two-thirds carry a rate under 5%. Both of those figures are down from record highs in 2022, but still enough to keep people from listing their homes and taking on a 7% rate on something new.
Household Mobility: The U.S. Census Bureau mobility data shows the share of Americans who moved in the past year has fallen to 11.8%, the lowest on record. Fewer moves results in fewer move-triggered remodels and system upgrades for the upper-middle market bracket. Homeowners are staying put and living with what they have.
Remodeling: Financing costs compound the problem in terms of freeing up money for remodels. With high borrowing rates in place, homeowners are reticent to borrow against their home equity to fund a midsize integration project. That’s a barrier for a homeowner weighing a $30,000 lighting-and-AV upgrade financed through a HELOC.
That hesitancy is showing up in general contractor data. The Farnsworth Group’s Contractor Activity Tracker shows 60% of contractors postponed or canceled jobs in the second quarter of 2026, up sharply from 31% just a year earlier. Material availability, scheduling, and budget pressure were cited as the leading causes. Integrators plug into that broader remodeling ecosystem, and when the general contractor’s project stalls, so does the AV package that would have ridden along with it.
Consumer Spending and Sentiment: Roughly half of homeowners across every income bracket say the economy and inflation were their top concerns over the past year. Real disposable income grew just 0.6% in 2025, the weakest showing since the outright decline of 2022. Meanwhile, the savings rate ticked up as households pulled back on discretionary spending. That’s precisely the psychology that turns a planned $35,000 whole-home project into a scaled-back $18,000 one — or shelves it for another year.
The D-Tools data hints that integrators are already adapting. There’s an increase in smaller entry-level contracts and a corresponding drop in the number of integrators booking $25K to $50K packages. That signals that some integrators are deliberately breaking large projects into smaller phases to reduce sticker shock. Others are diversifying into higher-margin categories like lighting and shading.
The takeaway for integrators heading into 2027 isn’t that the market is bad, because the median numbers say otherwise. Likewise, the market “average” may not be your average, because literally the “average” is only one-third of the market.
The D-Tools “2026 Midyear Market Report” is available for free at https://www.d-tools.com