It happens every Fall — the weather turns cooler, football season kicks off, and Residential Systems presents its annual State of the Industry report. Historically, this report is based on aggregate data from several industry proposal systems, as well as a distributor’s perspective, and this year is no different, including aggregate proposal data from Portal.io, a market perspective from ADI Global, and a sidebar with information from the first Mid-Year Market Health Report, recently released by D-tools Data.
Tradition aside, a new year brings a fresh perspective on how aggregate data is analyzed. In the past few years, the annual State of the Industry report has included aggregate product data from Portal across all created proposals, whether or not those proposals were won. This year, the Portal-provided data looks at closed/won projects, as the focus is on real market insights (what’s being sold). One isn’t more or less accurate than the other, they just represent different views of the market.
“After working with vendors on our Market Insights platform for the last 18 months, we’ve become very intentional about how we look at the aggregate data,” says Josh Willits, COO of Portal. “Submitted proposals show us the mindshare that a brand has with dealers as a whole, while closed/won proposals show us what’s actually happening in the market. For a mid-year market report, we’re recommending that we look at the actual sales data to see how the industry is performing year-to-date.”
So, How Are We Doing?
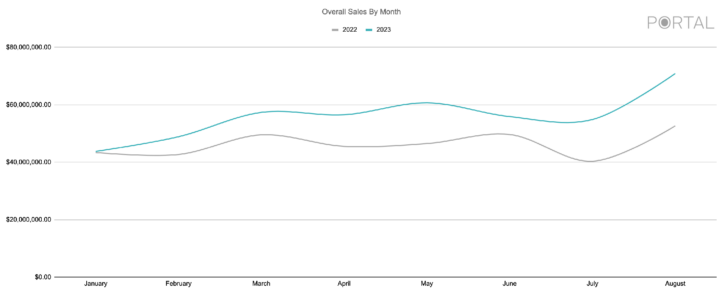
While industry growth has slowed from the highs during the pandemic, it does continue to push upward. Figure 1 shows overall dealer sales in January through August 2023 versus the same time period in 2022. While both years have similarly shaped curves, 2023 took off in January and stayed a nice distance above 2022’s numbers for the duration.
In accordance with the increase in sales, the overall average closed/won proposal value jumped up 4.29 percent from $15,422.59 in 2022 to $16,083.81 in 2023, although the number of overall accepted proposals by dealer held steady — 29.10 in 2022 versus 29.18 in 2023.
If you remove Portal’s user growth from 2022 to 2023 and compare only those companies who have been active for two or more years — a truer apples-to-apples comparison— the percentage is even higher, with average proposal size going from $14,541.87 in ’22 to $15,372.65 in ’23, a 5.71 percent rise. [Note: This differs from the recent D-Tools 2023 Midyear Market Health Report, which reports proposal sizes dropping 5.2 percent. See the sidebar for more details.] In this comparison, the average number of proposals climbs from 32.6 to 34.9.
What’s Selling?
When we turn our attention to the gear being specified, we get the familiar-looking Figure 2, which shows the ten top-selling product categories. While the top ten are the same as last year, their order has changed somewhat — Lighting jumped up three spots to the fourth position, Control dropped two spots, Networking got a bump, and Signal Distribution continued its decline. Speakers remained the top-selling category, by far.
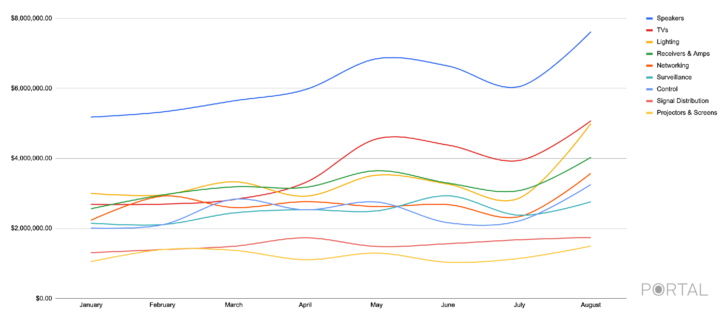
Most of the products follow the same curve that we have been observing for years — a slow rise to a peak in May, followed by a significant dip in July, and a return to form in August. It should be noted that these product sales charts are listed according to the date the clients accepted the proposals, not when they were created.
That curve shows up again in Figure 3, which shows the second-tier product categories, although a few categories do break from the norm. Window Treatments, for example, get a bump in May and July, while Access Control finds its success in March and June.
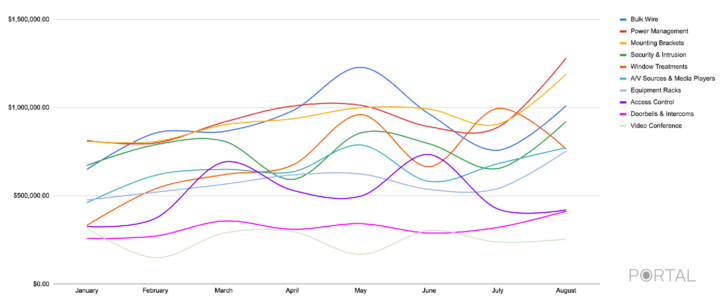
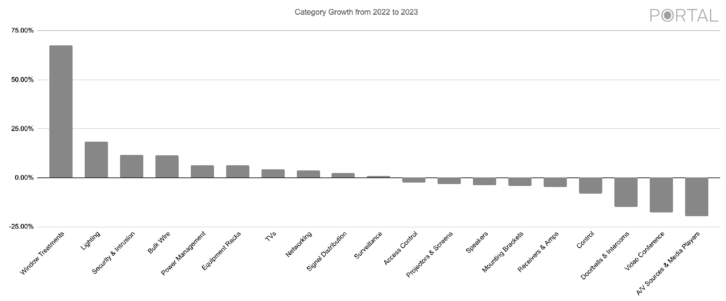
Figure 4 shows which categories grew the most over the past year. Unsurprisingly, Shades and Lighting lead the pack, with more and more dealers discovering how shades can impact their businesses through not only additional category sales and volume, but better average profit margins.
With lighting continuing to grow as a category and lighting fixtures in particular promising to break out in the next year or so, Portal took a deeper dive into these categories. Figure 5 shows sales in the Lighting category, which includes keypads, switches, dedicated lighting processors, and lighting fixtures, from January 2022 through August 2023. Figure 6 shows just the Lighting Fixture subcategory sales over that same time period.
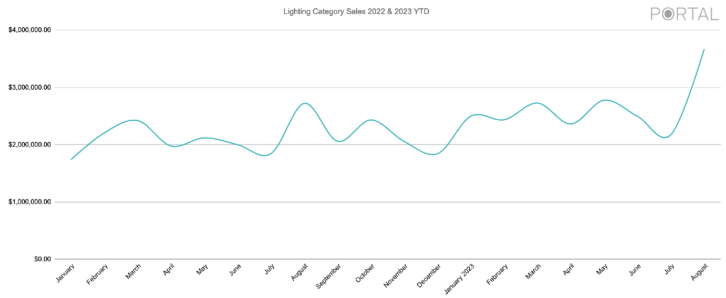
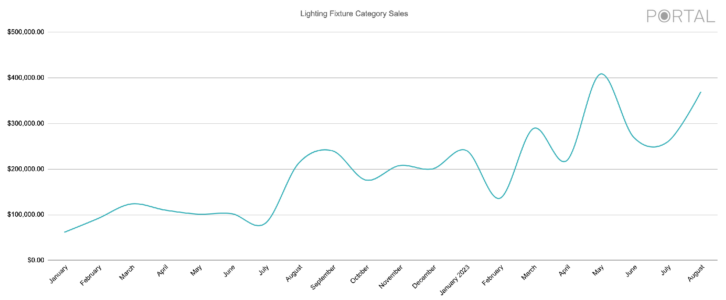
The Lighting category moves along at the typical CI industry rhythm — dips in July, peaks in August — with an added bump in March. Lighting Fixtures shows great growth over the time period, with a big bump in May 2023. Still, it is worth noting that the dollar amount for lighting fixtures greatly trails that of the Lighting category, which leaves plenty of room for growth.
The Distributor’s View
“We continue to see new growth opportunities across the residential AV market,” says Cynthia Menna, vice president and general manager of AV at ADI Global Distribution. “There are many growth drivers, including new advances in technology, consumer demand for integrated systems and a greater need for convenience and comfort, a growing interest across smart home solutions, and an increase in home offices, home theaters and outside entertainment areas. Products and solutions previously reserved for luxury installations have now become more mainstream — creating new opportunities. Additionally, the DIY market has helped drive interest and demand for these technologies, and lower price points have made them more accessible to a wider population.
“Users want all their systems to work together seamlessly, and the capability to control them remotely from their device. From security, AV, lighting controls, automation, temperature controls, video doorbells, whole house audio, and beyond, homeowners see value in these systems and are willing to invest in them. More networking, Wi-Fi, and videoconferencing installations are taking place as more home and hybrid working models, wireless gaming, and streaming content activities are taking place across the home.
“What was previously seen as two separate categories (Resi and Pro) are now crossing over into what we refer to as ‘resimercial.’ We’re seeing more and more integrators broadening their offering by expanding into adjacent categories, and serving customers they may not have considered in the past. And ADI is helping our customers make this transition with help from our local sales teams and our systems group.
The Way We Were: Check Out State-of-the-Industry Reports from 2020-2023
“Additionally, we continue to see improvements across our supply chain, which is also helping to drive growth. For example, we’ve been experiencing an uptick in sales across projectors, large-screen displays, and accessories, along with videoconferencing technologies. We continue to see strong growth with brands like Epson and Sonos, and are focused on expanding our offering with new brands that our customers need (and want) to build complete systems. We’ve also been ramping up our exclusive brand offerings to bring even more choice to customers. Our AVARRO line offers high-quality AV products for some of the toughest applications across residential and commercial installations. The AVARRO line includes racks, display mounts, video distribution, cabling, speakers, and more.”
Conclusion
Overall, business is good, down from great. The rapid growth of the past two years may have subsided, but in its wake, it left a strong industry that reflects modest, realistic improvements.
For more detailed, brand-specific sales data, manufacturers and distributors can contact [email protected].
D-Tools 2023 Midyear Market Health Report
Are We Back to Pre-COVID Norms in the Residential Market?
By Jason Knott
The “new norm” for the custom electronics industry is once again the “old norm.” We are not talking about Norm on Cheers, but for many custom integrators, it might be time to have a beer. Why? Because the seemingly never-ending flow of new business spurred by Covid-19 appears to have subsided back to the market’s pre-pandemic state, which means the need to generate leads and conduct the basic blocking-and-tackling of successfully closing sales is back in vogue.
The recent D-Tools 2023 Midyear Market Health Report is a confirmation that the market dynamics have shifted to mirroring the general economy once again versus the anomaly of skyrocketing growth from 2020 to 2022. According to the report, which was drawn from just under 100,000 actual proposals created in D-Tools Cloud, the average residential project size in the first half of 2023 fell by 5.2 percent.
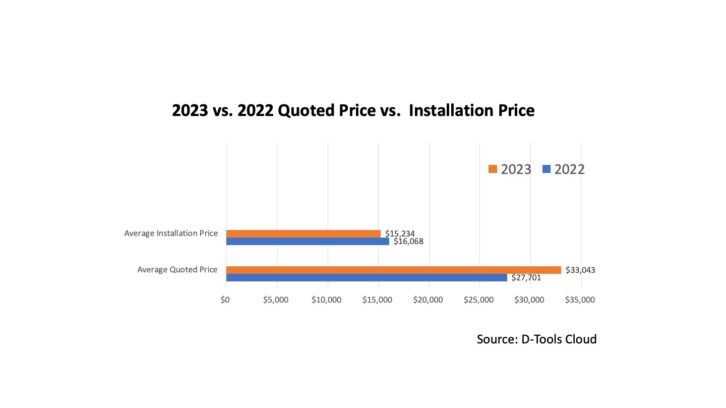
That drop was preceded by a decrease of 4 percent in the second half of 2022 as the market cooled off. So, if the last half of 2023 ends up mirroring the previous year, the market could experience a full 18 months of smaller project sizes (full-year 2023 data will not be available until early 2024). To be clear, the information does not necessarily reflect total revenues from custom integrators, because it does not include commercial project income or revenue monthly revenues (RMR) service/monitoring income.
Interestingly, the research shows that integrators are doing more projects than the previous year, and they are creating proposals for customers at much higher price points…indeed, 19 percent higher average price. So, how can that possibly translate to lower revenues? The answer lies in the amount of value-engineering that is taking place.
On average, the data shows that just 47 percent of what is recommended in the initial proposal ends up making it into the final project. Why? It is likely due to consumers being a bit more cautious given the precarious general economy, and it is likely a sign that more consumer-grade products are making it into the final installations. These lower-cost products often have recognizable brand names that are attractive to consumers. That recognition can sometimes help close the sale, but also tamper down project revenues (and profits).
But the most alarming conclusion from the D-Tools 2023 Midyear Market Health Report data is the product-versus-labor blend. Even after the growing emphasis on valuing labor for the past several years, just 23 percent of project revenues were attributed to labor compared to 77 percent for equipment. While that is up from 21 percent versus the first half of 2022, it is still well below norms in the 30 to 40 percent range touted by industry consultants such as VITAL. As a comparison, electricians routinely earn 70 percent of their revenues from labor and only 30 percent from equipment, so the custom electronics industry still has a long way to go in terms of valuing its labor.
Jason Knott is data solutions architect and evangelist for D-Tools. The 2023 Midyear Market Health Report is available as a free download in the D-Tools Resource Center.